GEOTECHNICAL ENGINEERING1
IPSWICH
HomeLaboratoryGrain size analysis (sieve + hydrometer)

Grain Size Analysis Ipswich: Sieve & Hydrometer Testing to BS 5930

Sound ground. Sound decisions.

LEARN MORE

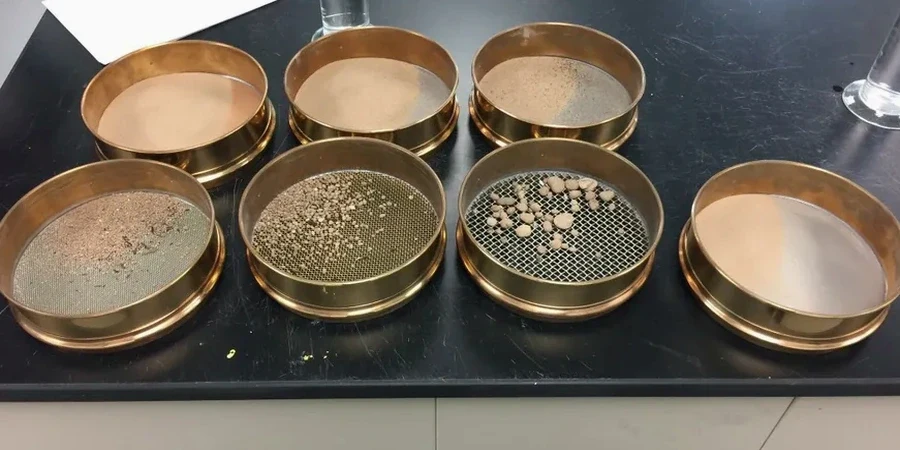
The British Standard BS 5930:2015+A1:2020 remains the backbone of site investigation practice across the UK, and nowhere is its application more critical than on the variable Quaternary deposits underlying Ipswich. From the chalky till of the Lowestoft Formation to the alluvial silts flanking the River Orwell, a solid grain size analysis determines whether a soil can support a shallow foundation, serve as engineered fill, or requires replacement. Our laboratory combines dry sieving for the coarse fraction (retained on the 63 μm sieve) with the sedimentation hydrometer method for silts and clays, producing a full particle size distribution curve that feeds directly into the Atterberg limits assessment needed for plasticity classification under the Unified Soil Classification System. For contractors working on the Ipswich Northern Route improvements or residential schemes in the Priory Heath area, getting the grading right before the first lorry of imported fill arrives saves weeks of delay.

A grain size curve is not just a lab report — it is the first honest conversation you have with the ground about what it can and cannot carry.
Our service areas

Process and scope

A recent project on a brownfield site near the Wet Dock involved a four-storey apartment block where the initial trial pits revealed a metre of made ground overlying laminated silts with occasional sand lenses. The developer needed to know whether the natural ground could carry a mat foundation without excessive settlement, and that question hinged entirely on the fines content and the uniformity of the grading curve. We ran a full combined sieve and hydrometer analysis on six bulk samples, identifying a gap-graded material with 22 per cent sub-75 μm fines and a coefficient of uniformity around 4.8 — marginal for direct bearing. The data allowed the structural engineer to adjust the bearing pressure and specify a compacted granular replacement layer, avoiding the cost of piling while keeping settlement within the 25 mm serviceability limit required by Eurocode 7. In Ipswich, where the interface between the Kesgrave Sands and Gravels and the underlying London Clay basement creates sharp permeability contrasts, knowing exactly where the silt fraction sits in the distribution often makes the difference between a straightforward soakaway design and a failed BRE 365 infiltration test.
Grain Size Analysis Ipswich: Sieve & Hydrometer Testing to BS 5930
Technical reference — Ipswich

Local considerations

One pattern we see repeatedly across Ipswich is a site investigation that relies on particle size distribution from disturbed bag samples without verifying the in-situ density or the natural moisture content of the fine fraction. A grading curve can look perfectly acceptable for a Type 1 subbase specification, but if the fines are predominantly active clay minerals derived from the London Clay basement — which outcrops in the northern and eastern parts of town — the material will swell, shrink, and lose stiffness with seasonal moisture cycles. On a recent industrial unit near Ransomes Europark, a floor slab designed on a CBR value inferred from grading alone developed shrinkage cracks within eighteen months. The root cause was a fines fraction of 16 per cent with a plasticity index above 25, something the grading curve alone could not reveal. We always recommend pairing grain size analysis with Atterberg limit tests and, where drainage is critical, an in-situ permeability test to confirm that the hydraulic conductivity implied by the grading matches field reality. Overlooking this step in the Orwell Basin, where groundwater rises to within a metre of ground level in winter, turns a minor testing oversight into a long-term maintenance liability.

Need a geotechnical assessment?

Reply within 24h.

Email: contact@geotechnical-engineering1.com

Reference standards

BS 5930:2015+A1:2020 — Code of practice for ground investigations, BS 1377-2:1990 — Methods of test for soils for civil engineering purposes: classification tests and determination of geotechnical properties, BS EN ISO 14688-1:2018 — Geotechnical investigation and testing: identification and classification of soil, Eurocode 7 — BS EN 1997-1:2004+A1:2013 Geotechnical design, BRE Digest 365 — Soakaway design (grading controls infiltration rate)

Reference parameters

ParameterTypical value
Test standardBS 1377-2:1990 & BS 5930:2015+A1:2020
Dry sieve range75 mm down to 63 μm
Hydrometer range63 μm down to 0.6 μm (clay fraction)
Sample mass (coarse soils)Minimum 3 kg (depending on Dmax)
Coefficient of uniformity (Cu)Reported as D60/D10
Coefficient of curvature (Cc)Reported as (D30)²/(D60×D10)
Fines content thresholdPer BS EN ISO 14688-1 classification
Turnaround (standard)3–4 working days from sample receipt

Frequently asked questions

How much does a grain size analysis cost for a site in Ipswich?

A standard combined sieve and hydrometer analysis on a single disturbed sample typically falls in the £80 to £150 range, depending on the number of sieves requested and whether the hydrometer phase needs extended sedimentation readings. Projects requiring multiple samples, rapid turnaround, or additional reporting for earthworks specification compliance are priced per sample with volume discounts available — we can provide a formal quotation once we understand the scope of your investigation.

Can you test gravelly soils from the Kesgrave formation for use as Type 1 subbase?

Yes, the Kesgrave Sands and Gravels that underlie much of Ipswich are routinely tested for compliance with Series 800 and Series 600 specifications. We run a full dry sieve from 75 mm down to 63 μm, reporting the percentage passing each sieve size, the fines content, and the uniformity coefficient. If the material is intended for unbound subbase, we also check the grading envelope against the tabulated limits in the Manual of Contract Documents for Highway Works and can coordinate with CBR testing if a performance-based specification is required.

Why do I need a hydrometer analysis if a sieve test already shows low fines content?

A sieve test alone stops at 63 μm and gives you only the total percentage passing that sieve — it cannot distinguish between silt-sized particles (which drain reasonably well and have low plasticity) and true clay-sized particles (which control shrinkage, swelling, and long-term stiffness). Even a soil with only 10 per cent passing the 63 μm sieve can behave poorly if most of that fraction is active clay derived from the London Clay, which is widespread across the Ipswich area. The hydrometer analysis extends the grading curve down to 0.6 μm, giving you the clay fraction needed to classify the soil correctly and to predict its behaviour under repeated wetting and drying cycles.

Location and service area

We serve projects in Ipswich and surrounding areas.

View larger map